

Finding success in today’s app landscape depends on making real time, data-driven decisions - that means monitoring new app releases, analyzing KPIs, A/B tests, and segments, and comparing metrics with data captured in the moment.
ironSource real time pivot reports let you do just that:
- Understand trends in real time to recognize opportunities quickly
- Break your data by multiple measures and dimensions
- Easily compare different time periods
- View data using different visuals, like stack, line chart, bar chart, etc.
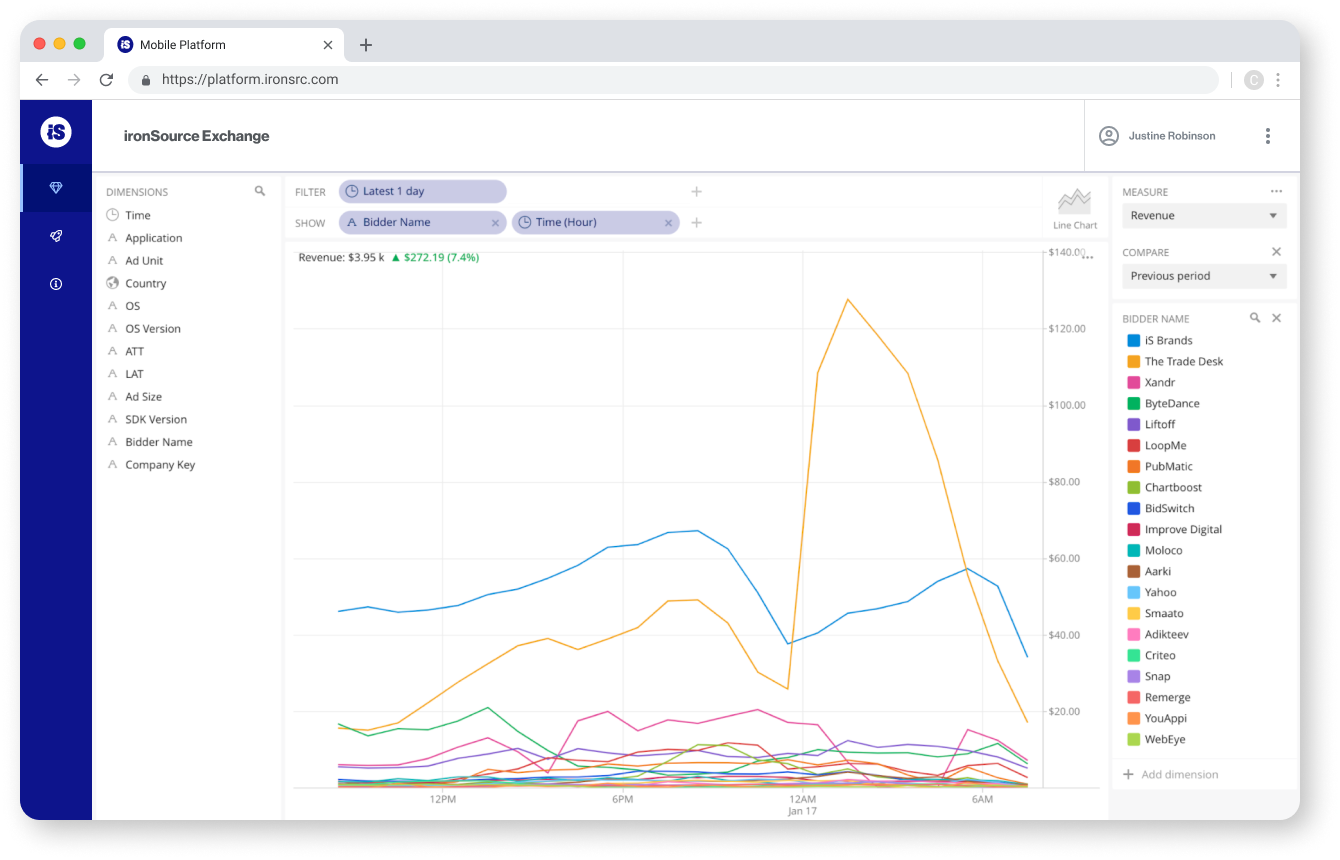
- Get full transparency into ironSource Exchange performance to see which DSPs are contributing to your revenue
So, what can you do to optimize performance with real time pivot reports that you can't with traditional reporting platforms? Let’s look at a few common scenarios.
1. Detect changes in performance the moment they happen
Reacting to performance changes fast can be the difference between earning and losing revenue - and access to data that’s updated in real time lets you do just that.
For example, after making changes to your monetization strategy (like adding a new network or releasing a new app version), it’s helpful to swiftly audit the adjustment to ensure it’s working well and not harming any key metrics. If a new network is hurting performance, you can remove it from your strategy immediately or talk to the network directly about the issue, reducing any long term damage.
Similarly, it’s important to be on top of your data when something dramatic happens, such as an internet outage or a new campaign set to bring in a large amount of new users. If there’s a decrease in performance, you can start trying to solve the problem right away, comparing metrics against each other to figure out what the problem is. If performance improves, you have a good baseline for the next promotion campaign and can work to improve performance even further. In the image below, revenue spikes for the network in yellow, indicating a dramatic event.
The same goes for A/B testing - you can analyze how the A/B test is performing as soon as possible, allowing you to iterate and adjust the test rapidly according to what’s working well for your app. In some cases, tests are very clear and you can make a decision for which iteration to keep and which to kill, fast - speeding up the A/B testing process and enabling you to test more often.
Generally speaking, with real time data, you can monitor the environment of your app and ensure it’s stable, every second of every day. With all of this data available at your fingertips, it’s also beneficial to compare metrics, especially revenue, over time.
2. Compare revenue over time
In addition to knowing when performance changes occur, it’s critical to understand why - and getting a clear picture of how your revenue performs over time can help determine the reasons for various drops or increases in performance.
Using a visual format (list, bar chart, table, grid) and choosing various different time frames, you may notice, for example, that revenue drops at 1am every Tuesday. Armed with this information, you won’t be alarmed the next time you notice the decline. On the other hand, if revenue starts spiking when it usually drops, you may want to dive deeper and compare measures.
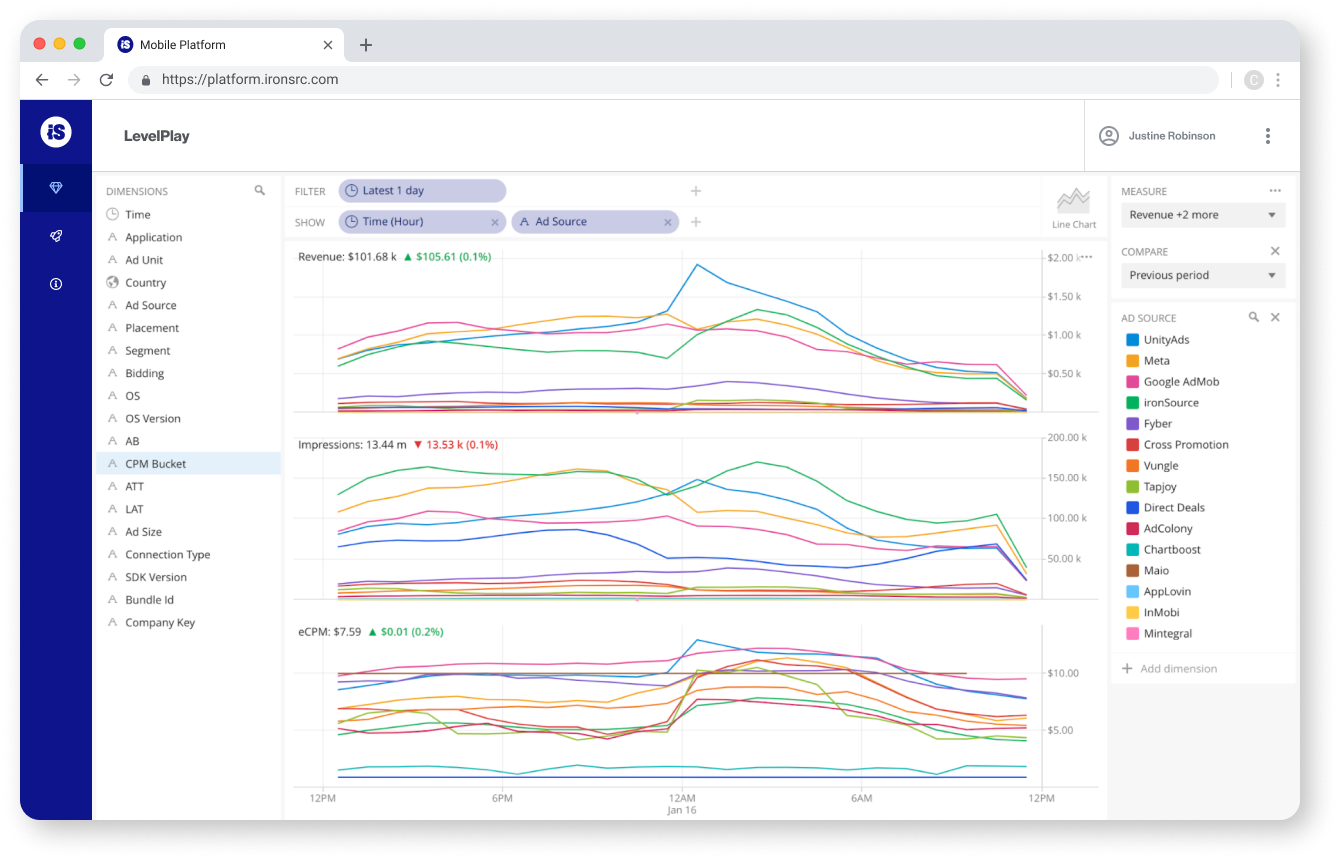
Here’s another scenario. Let’s say you’re looking at revenue by ad unit over time and notice a steep decline for interstitial ads that doesn’t follow the usual trend. To get a better idea of why this may have occurred, you can compare revenue to another measure, such as auctions (ie ad requests), and analyze the graphs directly next to each other.
If you notice less traffic coming to your app - which you can measure by monitoring the number of auctions - at the same time there’s a drop in revenue, you may have your answer. In this case, you should analyze the traffic and why you believe it might have dropped - for example, perhaps it’s a holiday and there are fewer people playing. If there are no viable explanations for revenue decline, it may have been due to a technical issue, which means you may want to reach out to the network directly.
With this knowledge, you can pinpoint anomalies in revenue and get to the root of them. You can also dive deep into your performance in the waterfall.
3. Use CPM buckets to optimize your waterfall
CPM buckets show you how much revenue and how many impressions you’re getting from each CPM price range, giving you a more granular idea of how different networks are competing in the waterfall.
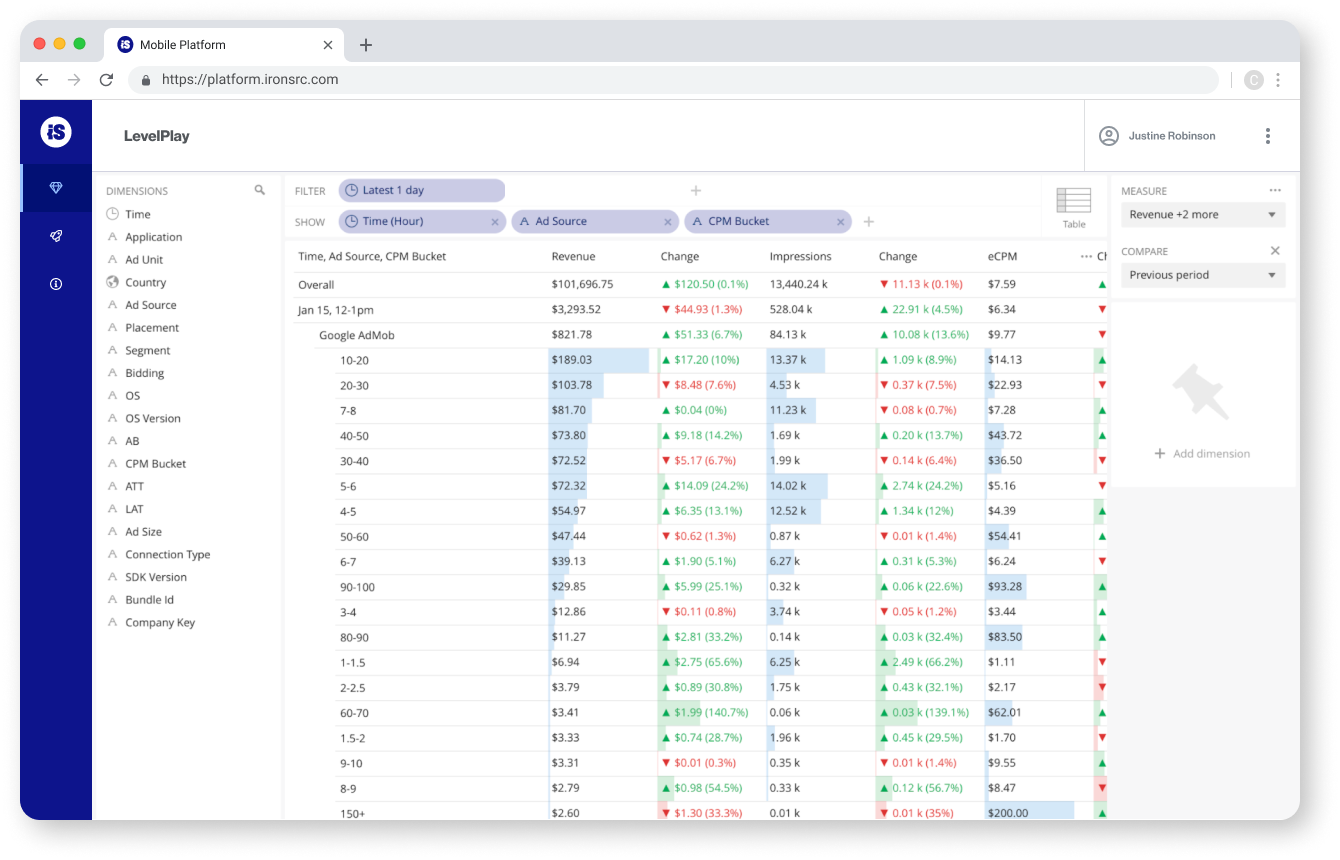
Typically, you’re only able to see each ad network’s average CPM. While an important metric to keep track of, CPMs can range anywhere from $1 to over $150 - but 2,000 impressions with a $100 CPM results in more revenue than 40,000 impressions of a $3 CPM. Just looking at the average, you don’t get an understanding of distribution across all of the prices.
On the other hand, by separating CPM prices into buckets, you know exactly where your impressions and revenue are coming from, allowing you to track and analyze new opportunities.
For example, let’s say you see most of your revenue coming from the $10-40 CPM bucket - and by comparing networks within that bucket, you see it’s all coming from a single non-bidding network. If other strong non-bidding networks aren’t providing any revenue in the $10-40 bucket, dig deeper into why. Do you have available instances there for other networks? If not, maybe you should consider adding some. If you do have instances there, do they have low fill rates? If so, you need to work on maximizing placement performance.
You can even compare networks directly against each other to determine who is bidding the highest for top CPMs. This will give you an idea of the networks performing best for your app, allowing you to spend time investing in the right resources.
Getting access to real time data through real time pivot reporting is a new and granular way to optimize your monetization performance and ensure you’re making the right data-driven decisions for your app. Ultimately, the choice is yours, and it seems pretty obvious. After all, data updated instantaneously is better than data updated every few hours.
Learn more about ironSource real time pivot reports here

