

The success of subscription apps is largely determined by the probability of users converting and becoming subscribers. To structure a growth strategy with this in mind, it’s important to focus on the long-term value of each user, and the LTV (lifetime value) model is a powerful and comprehensive way to do so.
LTV, which is revenue/number of users, is a prediction of how much a user is worth to your app over the user’s lifetime - for example, we’d say an app’s LTV is $15 in a period of 24 months. Shachar Arias, Growth Analysis at ironSource, shares his insights on why LTV is important for your subscription-based app and offers tips for how to master it.
Why is LTV important for subscription apps?
Let’s look at why you should be focusing on LTV for your subscription app.
Determining user acquisition costs
Deciding how much you’re going to pay for a user without using LTV is comparable to calculating your monthly spending budget before knowing your salary - it’s possible you’ll overspend without knowing it. By comparing LTV to the cost of acquisition, you can optimize your business for more profits and decide the most suitable budget for your UA campaign cost, as you always want to pay less than your LTV unless there’s a strategy behind it. Overall, LTV paints an honest picture of whether users are spending enough to cover these acquisition costs and exceed it (making you a profit), or whether your strategy needs adjustment.
Determining cash flow
While you may not see post-install profitability for months or years, due to the nature of subscriptions, LTV gives you an idea of overall cash flow and allows you to predict future cash flow as well. The more cash flow you see, the more you know you can spend.
Measuring the effect of app changes
LTV is helpful for determining the impact of the changes you make to your app. When adding new features, altering the UI or UX, or adjusting the subscription flow, you can use LTV to make decisions on whether these changes are improving or hurting your bottom line.
4 tips for mastering the LTV model for your subscription app
It’s important to remember that subscription apps behave differently than non-subscription apps, which means there are some unique best practices to consider. Let’s dive into some tips for constructing a winning LTV model for your subscription app.
1. Start with the ARPU curve
ARPU, or the average revenue per user, is calculated by plotting the accumulated revenue generated by a segment of users in the days after install. To determine ARPU, divide the amount subscribers pay each week, month, year, etc. by the number of installs. ARPU is always calculated on a specific day after install. For example, if a segment of 1,000 users generates $1,000 over 1 month, the Month 1 ARPU would be $1. If those 1,000 users generate $2,000 over 3 months, the Month 3 ARPU is $2.
When building the ARPU curve for subscribers, it’s important to note that there are fewer revenue generators to work with compared to non-subscription apps (in contrast to in-app purchases and ads, only the subscription costs are included), making the process for determining future predictions slightly different. For some apps, you can stop at choosing a relevant ARPU goal, 6 months for example, to determine the value of your users. For most, however, you’ll need to construct an LTV model from the right trendline.
2. Choose the right trendline for your LTV model
The LTV model is constructed by placing a trendline over the average revenue per user (ARPU) curve, which fills in the revenue predictions from the last day of calculated data to the end of the users’ lifetime in your app.
While a logarithmic trendline usually works better for the LTV curve for non-subscription apps, ironSource has found that a power curve fits over the ARPU the most accurately for subscription apps. This is because, first, the revenue stream for subscription apps is not dependent on user engagement with the app, and second, subscription apps tend to offer some kind of utility that stands the test of time.
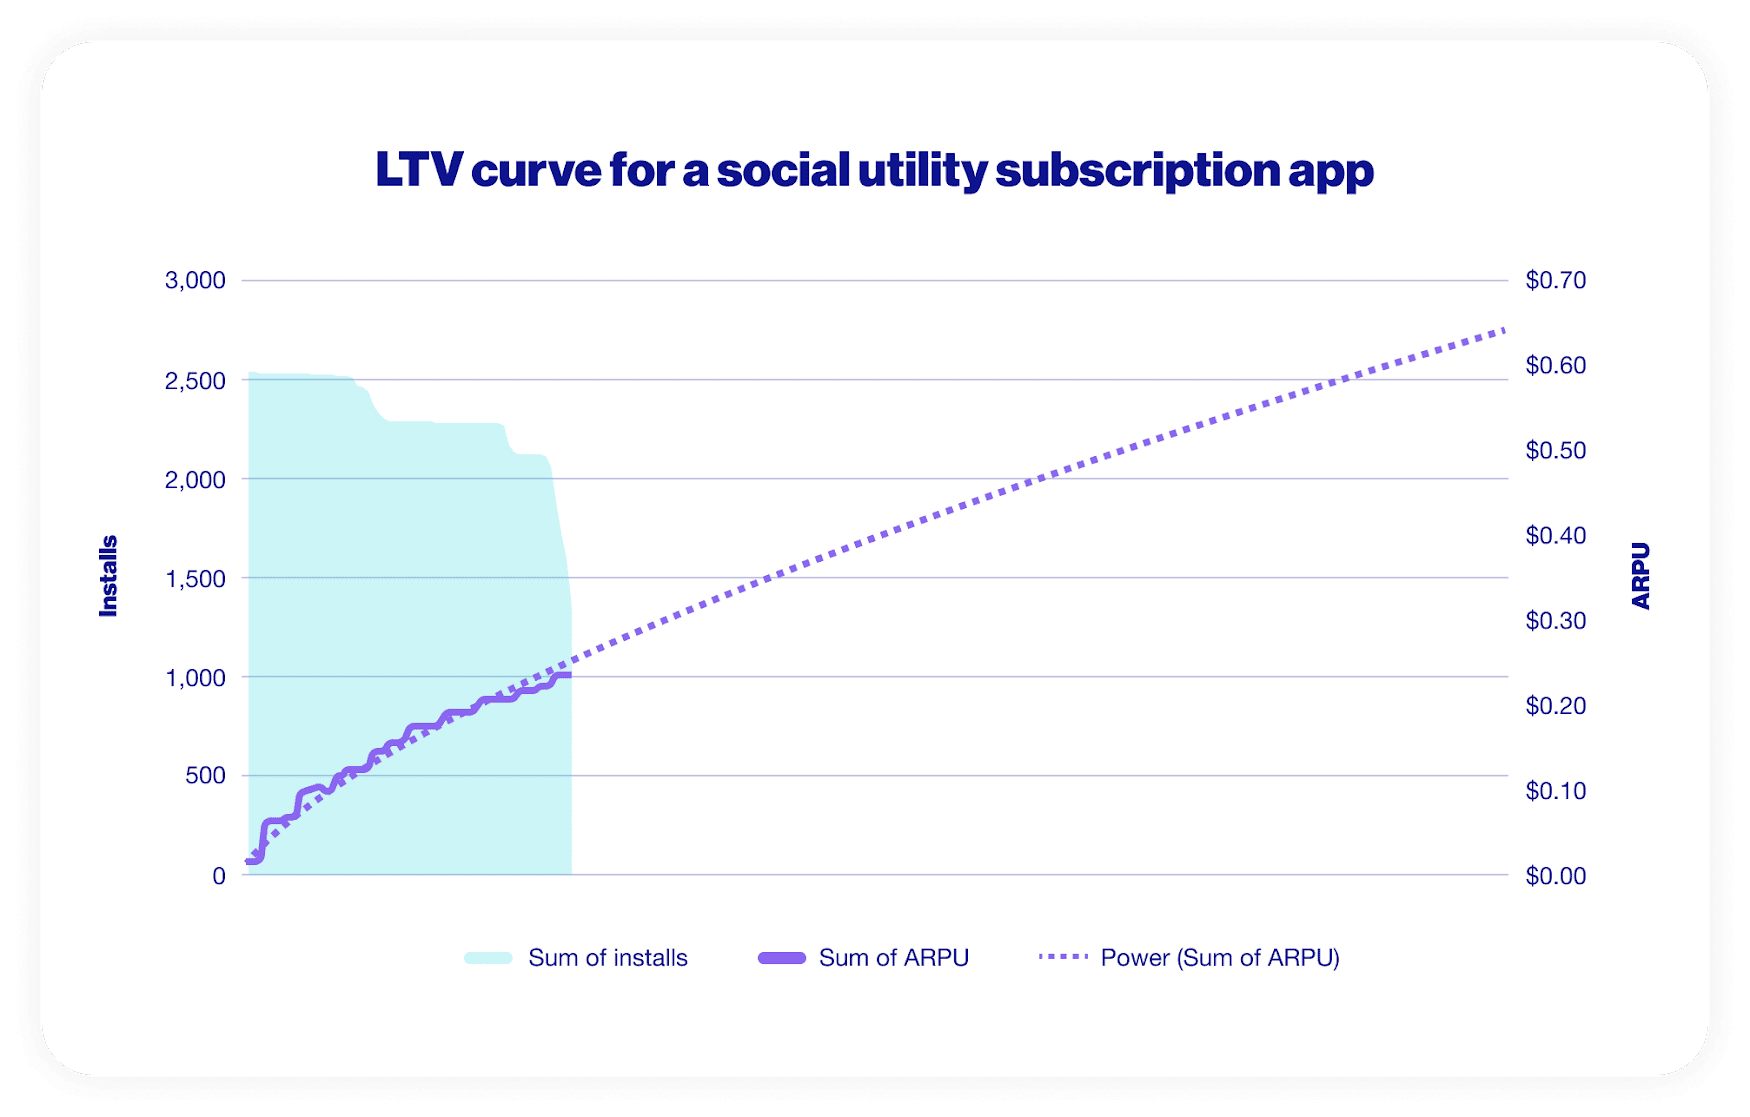 The graph above is the LTV model for a social utility subscription app that works with ironSource. As you can see, we plotted the ARPU curve (solid purple line) based on data we already had. From there, we placed a power curve (dotted purple line) to predict the future revenue. Based on the graph, we can assume that the LTV for the average user will be $0.65.
Some subscription apps, however, are starting to incorporate other forms of monetization, such as ads or in-app purchases. When building the LTV curve for a hybrid model, you have to keep in mind the behavior of these components - separate the curves for each component (logarithmic for ads and IAPs and power for subscription) and then stack them together for a more accurate prediction.
 Once you have a solid LTV model for your subscription app, you can start measuring the granular metrics that will ensure your LTV is as precise as possible. There’s more to creating a winning LTV model than just choosing the right trendline.
3. Look outside of revenue
Making the most out of your LTV model comes down to being comfortable with the uncertainty behind an accurate revenue prediction. Typically, apps will have many more non-subscribers than subscribers, ultimately affecting revenue - with fewer users (and fewer revenue generators), there’s less data to work with. In addition, subscription rates are constantly changing.
With this uncertainty behind revenue, it’s important to be comfortable taking calculated risks with your LTV curve by looking at other engagement events outside of just how much a user is paying each week, month, or year. Ultimately, you should be tracking as many metrics as possible, as early as possible. For example, you can include any type of in-app engagement that could be an indicator of future subscription, such as opening the app a certain number of times, editing a few photos, etc. This granular understanding of your app’s overall performance will help you determine exactly where you stand, allowing you to streamline your strategy towards investing in the right users.
Note that when you start including other metrics into your LTV model, you should also consider building different models to reflect different revenue streams - subscription, IAP, ads.
4. Build a different model for each subscription time frame
Many apps offer weekly, monthly, and annual subscriptions, making LTV construction more difficult. At the end of the day, these users are going to behave differently and bring in revenue at different rates - it’s not one size fits all.
Rather than converting annual subscriptions to the monthly equivalent, it’s better to build an LTV model for each subscription option - weekly vs. monthly vs. yearly. From there, if you’re including an engagement metric outside of revenue, you can apply a different rate to each model (since, for example, churn will be different for monthly users compared to weekly users). This way you’ll improve the accuracy of your LTV model and have a better idea of how specific users are interacting with your app according to different subscription models.
LTV is highly valuable for the success of your subscription app, but constructing the curve can be difficult. These tips will help you easily build the model that works for your app. It’s also recommended to get in touch with your UA partner to make sure your curve is the most accurate. In such a saturated app market, you always want to be investing in things that will make you money in the long run, and the LTV model should be one of your top priorities.

