
If you’re part of or work alongside a user acquisition team, then there’s no doubt you’re familiar with the highs and lows that come with creative performance. You could spend days or weeks collaborating, learning, and testing to evolve a new concept, only to achieve below average results.
But there’s something perhaps even more challenging than coming to grips with the results themselves, and that’s understanding why the performance is low. This black box of creative performance - an unknown force that causes some creatives to perform and others to flop - can leave even an experienced team scratching their heads.

While we may not ever understand exactly how this black box works, we can understand how to work with it. To do this, creative teams need to draw on skills in both the art and science of creative analysis. Let’s dive in.
Working with the black box
Not only does this black box make it difficult for us to understand which elements within our creatives are driving performance, but it’s also constantly evolving, being heavily influenced by changes in ad networks' optimization models or industry trends. That’s why creative teams must create flexible frameworks and creative guardrails that allow them to deal with this ambiguity and still draw conclusions and action items.
One of these frameworks is called creative variation testing, which includes uploading similar-yet-different creatives and monitoring the performance in controlled tests (logically, any differences in performance between two similar creatives can be attributed to the creative differences themselves). For example, imagine three identical creative concepts whose only visible difference was a color theme - our conclusions from the below would be that our users prefer purple over orange or yellow.

As you can see with a simple example, while we may not understand the specific workings of this black box, we can still construct patterns in order to learn how input (the creatives) affects output (the performance). And critically, we can then use this knowledge to our advantage with future creatives.
Today, video tagging is one of the most common approaches used for creative variation testing at scale; studios will assign (and tag) broad themes and unique characteristics to videos, enabling simple analysis and actionable takeaways: “users prefer the jungle theme over the desert scene, many objects over fewer”.
Yet, like many of our processes recently, the iOS privacy updates have presented a challenge to creative variation testing. To use an approach like the above, you need large volumes of creatives and accurate data; however, both of these are massively constrained in our new SKAN reality. iOS 14 has made the already challenging goal of replacing subjective analysis with objectivity, even more complicated.
What about playable ads?
Though useful, creative variation testing is not enough when analyzing playable ads. That’s because, while there are two dimensions that drive video performance - the concept and specific characteristics (both of which can be tagged), there are three dimensions for interactive experiences - concept, characteristics, and user interaction. User interaction, however, is unknown (and cannot be tagged) since users dynamically change the outcome of their experience based on their input, such as winning or losing the playable.
So you can design a killer concept and apply a huge amount of polish, but if you're lacking a tutorial, challenge, progress encouragement, etc, then the user won't know how to get the most out of the experience. By missing out on these experience hooks, you’ll never give the concept a fair chance and may end up in the worst-case scenario - concluding incorrectly that the concept failed. But don’t worry, not only is there a solution to analyzing playable ads, but there is one that is by far more powerful than any other approach used in creative analysis.
What are playable (in-ad) analytics?
Because of that third dimension - user interaction - there are many more data points for us to analyze in playable ads. Rather than just impressions and clicks, now we can see user drop offs, level completions, and taps. Each of these metrics allows us to create a narrative around creative performance; it asks and answers questions that enable us to improve the user experience and associated outcomes. Put simply, the creative black box between impression and click can be enriched with actionable insights.
At the most basic level, in-ad analytics uses in-game events to log key milestones and user interactions. From a technical perspective, JavaScript in the HTML asset triggers an API call to a server, which picks up these events and stores them in a database.
How and when to use in-ad analytics
Today, the majority of SDK networks support playable analytics (and with Luna Playground, is available out of the box) - so as long as you have the desire and a team that’s ready to take action on this invaluable data, you should leverage in-ad analytics whenever possible.
Let’s imagine a scenario with some sample data before and after using playable analytics.
Scenario 1: Your playable goes live and you accumulate data for two days. Here’s what you see:
- Impressions: 10,000
- CTR: 23%
- IPM: 7

Your target IPM was 14. As a creative team, how do you respond to these results? Has the concept failed, or is there something else at play? Maybe you can adjust your targeting and bids to reach higher quality users. But is that the problem? Only 23% of users are clicking through to your app store listing. What about increasing the clickable areas or changing the style of your end card? Can that increase the CTR by 10%?
As you can see, there are infinite questions and just as many hypotheses that arise as a result of this limited data set. With video, these questions will remain until you run adequate tests - but it doesn’t need to be like this with playable ads.
Scenario 2: Let’s take another look at these results but this time, with some common playable in-ad analytics data.
- Impressions: 10,000
- CTR: 23%
- IPM: 7
- Engagement rate: 65%
- End card shown: 35%
Bingo 💡
35% of users saw the end card and 23% clicked. That’s good! 23/35 = ~66%. The end card CTR isn’t our biggest problem by far, but by using the previous data set, we would have likely wasted time and money on more tests to find this out.
Our main problem is the gameplay experience. How can we tell? 65% of users engaged but only about half made it through - clearly something is wrong.
To confirm this, we can use additional events (such as level progress) to dig deeper into the problem, and eventually unlock double-digit improvements through small adjustments.
Steps to getting started
Now that you see the value that can be derived, here comes the important question - how should you structure the events in your playable to make these kinds of decisions. How many, how often, what, when, and where?
At Luna, we hear this question all the time - so here’s our advice on how to approach it, based on the thousands of playable ads we’ve analyzed over the years:
1. Identify the key questions you may have about your playable experience
2. Create 3-5 events that will offer you the best return - focus on areas you can tangibly take action on
3. Measure the results, identify learnings and actions
4. Iterate and measure the results again
Keep reading for tips to handle the first two steps.
Identify key questions
Start with questions. Don’t blindly log the obvious contenders. Sit down as a team and answer the following:
- What do we hope to learn?
- What are we unsure about in the experience? For example, do users click left, or right?
- What changes could we quickly make to this playable, and how can we understand whether we should be making them - what data would we need?
- Can users make it through the full playable? Where might they get stuck?
- How can we measure whether my tutorial or in-playable hints are working?
Create 3-5 events you can tangibly take action on
With analytics, less is more, especially as you build out the internal processes to take action on the results. Most teams can analyze 3-5 events, whereas not many are ready to analyze 20.
Remember what you can feasibly change within your playable. It might be interesting to learn something about the creative, but if you can’t fix it without redesigning it completely, it won’t help you improve performance. You need to make a call on must-haves and nice-to-haves, and also be aware of which data you will use to learn vs that you will take action on.
If we take the example above, all we did was simply add an event at the start (did the user engage) and at the end (end card shown), yet the conclusions we were able to draw from this data far outweighed the effort needed to think about and implement it. These “bookends” of playable analytics should be used universally.
On top of these milestone data points that allow you to get a better understanding of the user flow, you can also use custom events to help you understand how user behavior impacts your KPIs.
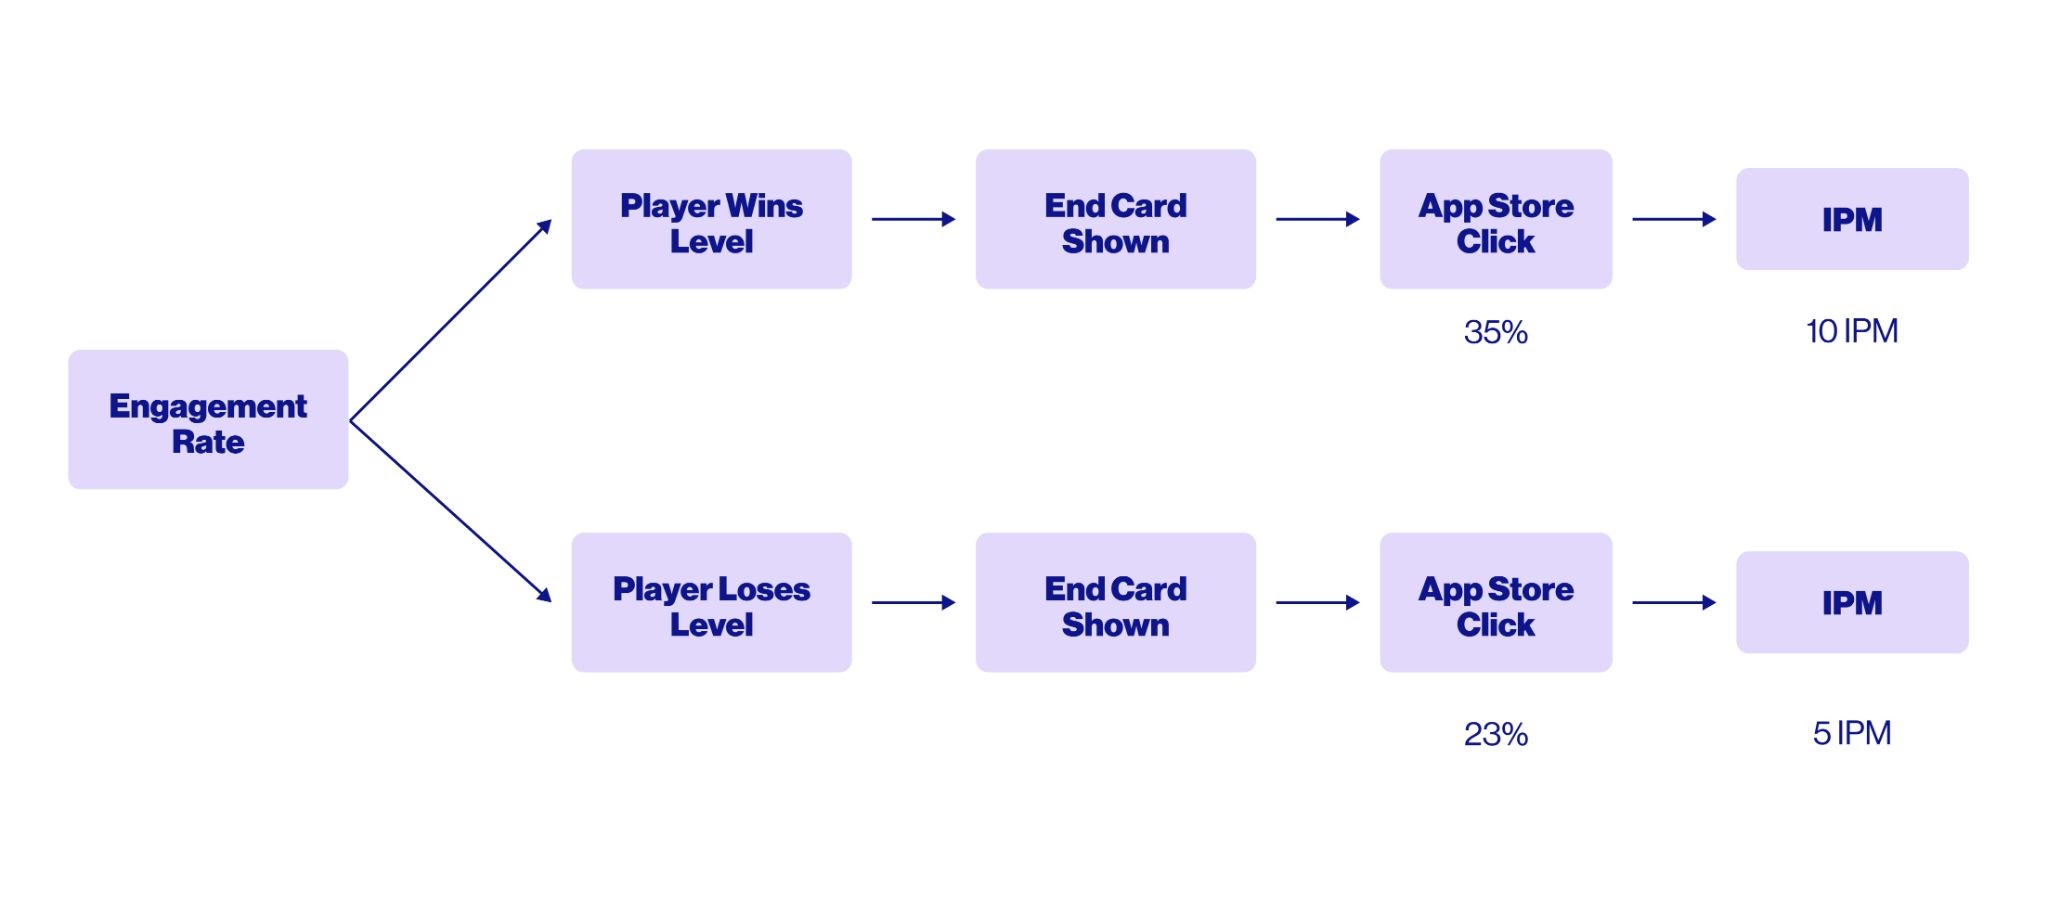
Take the following example:
In this scenario, we see that players who win the level are a) more likely to click the end card, and b) more likely to install. This learning is crucial; now you know to focus your next iterations on more “winnable” levels or rewarding experiences.
Following the two examples of how you can use in-ad analytics to understand both the user flow and the impact of experience on your KPIs, here are some events we typically recommend adding (of course, assuming your playable allows for them):
- Tutorial Engagement - the user interacted with the tutorial
- Level Start - a level was started
- Midway - the user reach a midway point
- Level Won - the user won a level
- Level Failed - the user failed a level
- Level Retry - a user retried a level
- Score - submit a playable score to understand progress
- End Card Shown - the end card was clicked
The power of data
The power of optimization is always in the data. Looking forward, we can expect in-ad analytics to become the mainstream solution for analyzing playable and interactive ads - perhaps with even more granular metrics being introduced down the line. Until then, be sure to leverage the in-ad data metrics available to you so you can optimize your playable ads as much as possible.